Build a real-time analytics dashboard
tl;dr Materialize can enable real-time monitoring within business intelligence tools, and we have a demo showing you that it’s feasible.
Traditionally, business intelligence tools rely on reading day-old answers from data warehouses. Given the substantial size of the data they’re required to process, it makes sense that you wouldn’t want to recompute the answer every time someone wants to view it.
Materialize, though, offers a totally different paradigm for powering BI tools that offers complex, real-time analysis over massive datasets. The fundamental idea is that Materialize persists the results of your queries, and then incrementally updates them as new data comes in. Unlike the traditional RDBMS model, which doesn’t rely on previously completed work, Materialize minimizes the time required to provide fresh answers.
Overview
In this demo, we’ll take the role of a business with a transactional workload running against our servers. To support the business' goals, we’ll stand up a BI tool to perform analytic-style queries over that transactional data.
BI tools often sit on top of complex infrastructure, which is unreasonable to spin up for a demo. To let you get a feel of what Materialize is like to use without an enormous investment of time, we’ve built out a Docker Compose file that can take care of the entire deployment for you.
In this section, we’ll cover the “what” and “why” of our proposed deployment using Materialize to provide real-time analytics within Metabase, an open-source business intelligence tool.
Dataset & load generator
For this demo, Materialize uses a custom benchmark called chBench that is really just a concatenation of two well-known database benchmarking tools, TPC-C and TPC-H.
TPC-C is an industry-standard benchmark for transactional workloads, meant to test a database’s scalability.
TPC-H is from the same group that developed TPC-C, and is meant to test the capabilities of online analytic platforms by performing complex analytic style queries. This includes large aggregations, many groupings, and complex multi-way joins.
CH-benCHmark brings together a TPC-C-like dataset with TPC-H’s analytical queries. This is a great approximation for how many businesses perform OLAP queries over OLTP data.
Database (MySQL)
This demo relies on MySQL, which is a stable, well-supported platform with good performance.
Change Data Capture & Streaming (Debezium & Kafka)
As the chBench load generator writes data to your database, we need to propagate those changes to Materialize so it can update the answers to your queries.
With MySQL, the easiest way to do this is through a change data capture (CDC) tool, which can describe changes to your data. This demo relies on Debezium as its CDC tool.
To ferry the CDC data to Materialize, we stream the data using Kafka. This requires a suite of tools from Confluent, e.g. ZooKeeper, Confluent Schema Registry, etc, which we’ve also included in our demo’s Docker deployment.
Materialize
Materialize ingests the CDC data from MySQL, representing the chBench load generator’s continued activity.
With that data available, you can perform complex queries, and Materialize maintains their results, even as the underlying data changes. This means that you can get answers to your queries in real time, rather than relying on day-old answers from your data warehouse.
BI Tool (Metabase)
Metabase is an open-source tool to create visualizations of SQL queries' results, and then group them into dashboards. For instance, teams might use Metabase to monitor geographic purchasing patterns from their stores.
In our demo, we’ll use Metabase to visualize the results of some TPC-H-like queries, and watch the visualizations update as quickly as Metabase allows.
In thinking of this deployment in terms of client-server relationships, this BI tool represents a client, and Materialize represents a server.
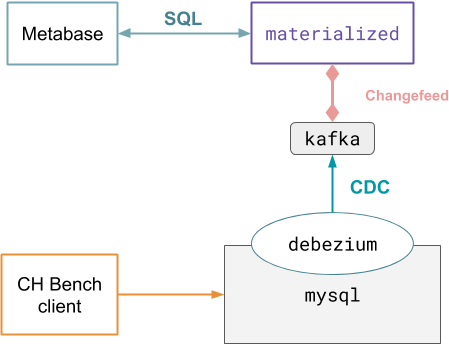
Diagram
Putting this all together, our deployment looks like this:
Run the demo
Preparing the environment
-
Set up Docker and Docker compose, if you haven’t already.
Note for macOS users: Be sure to increase Docker resources to at least 2 CPUs and 8GB memory. Running Docker for Mac with less resources may cause the demo to fail.
-
Clone the Materialize demos GitHub repository and checkout the
ltsbranch:git clone https://github.com/MaterializeInc/demos.git git checkout ltsYou can also view the demo’s code on GitHub.
-
Download and start all of the components we’ve listed above by running:
cd demos/chbench
docker-compose up -d
Note that downloading the Docker images necessary for the demo can take quite a bit of time (upwards of 10 minutes, even on fast connections).
When the script exits successfully, all components from the diagram above are active in Docker containers, and the chBench client is rapidly pushing data and transactions to the MySQL database.
Define sources & views
Now that our deployment is running (and looks like the diagram shown above), we can get Materialize to read data from Kafka and define the views we want Materialize to maintain for us.
-
Launch the
psqlshell against Materialize by running:docker-compose run cli -
Within the CLI, ensure you have all of the necessary sources, which represent all of the tables from MySQL. It may take a minute or two for these sources to appear.
SHOW SOURCES;debezium_tpcch_customer debezium_tpcch_district debezium_tpcch_item debezium_tpcch_nation debezium_tpcch_neworder debezium_tpcch_order debezium_tpcch_orderline debezium_tpcch_region debezium_tpcch_stock debezium_tpcch_supplier debezium_tpcch_warehouse -
Create a straightforward view of the underlying data.
CREATE MATERIALIZED VIEW query01 AS
    SELECT
        ol_number,
        sum(ol_quantity) as sum_qty,
        sum(ol_amount) as sum_amount,
        avg(ol_quantity) as avg_qty,
        avg(ol_amount) as avg_amount,
        count(*) as count_order
    FROM debezium_tpcch_orderline
    WHERE ol_delivery_d > date '1998-12-01'
    GROUP BY ol_number;
This is used to repesent “Query 01” in chBench, which tracks statistics about the TPC-C
debezium_tpcch_orderlinetable. -
Check the results of the view:
SELECT * FROM query01;If you run this query multiple times, you should see the results change, and the answers should come back pretty quickly. (How quickly depends on the speed of your computer, but sub-second responses are typical.)
-
Define another view for “Query 07”, which involves a complex 11-way
JOINacross 6 tables:CREATE MATERIALIZED VIEW query07 AS SELECT su_nationkey AS supp_nation, substr(c_state, 1, 1) AS cust_nation, extract('year' FROM o_entry_d) AS l_year, sum(ol_amount) AS revenue FROM debezium_tpcch_supplier, debezium_tpcch_stock, debezium_tpcch_orderline, debezium_tpcch_order, debezium_tpcch_customer, debezium_tpcch_nation AS n1, debezium_tpcch_nation AS n2 WHERE ol_supply_w_id = s_w_id AND ol_i_id = s_i_id AND s_su_suppkey = su_suppkey AND ol_w_id = o_w_id AND ol_d_id = o_d_id AND ol_o_id = o_id AND c_id = o_c_id AND c_w_id = o_w_id AND c_d_id = o_d_id AND su_nationkey = n1.n_nationkey AND c_n_nationkey = n2.n_nationkey GROUP BY su_nationkey, substr(c_state, 1, 1), extract('year' FROM o_entry_d) ORDER BY su_nationkey, cust_nation, l_year;This query sums revenue (
ol_amount) from the fast-changingorderlinetable and joins it with several other tables to show the total revenue between any two nations in a given year. -
Check the results of this query:
SELECT * FROM query07;It can take a few minutes to begin producing answers. Running the query while it is initializing will produce an empty set of results.
Once initialized, re-running the query should show updated values in the
revenuecolumn and the response times should be quick!
Set up Metabase
-
In a browser, navigate to
localhost:3030. -
Click Let’s get started.
-
Complete the first set of fields asking for your email address. This information isn’t crucial for anything but does have to be filled in.
-
On the Add your data page, fill in the following information:
Field Enter… Database type PostgreSQL Name tpcch Host materialized Port 6875 Database name materialize Database username materialize Database password Leave empty. -
Proceed past the screens until you reach your primary dashboard.
Create dashboards
-
Click Ask a question.
-
Click Native query.
-
From Select a database, select tpcch.
-
In the query editor, enter:
SELECT * FROM query01;Materialize relies on you already having created a materialized view with this name, which you did the Materialize CLI a few steps back.
In a production setting, you might want to let users find views' underlying queries. For example, you might store the underlying queries in a GitHub repository, and provide a link to the repository as a comment. Those with direct access to the
materializedprocess through a SQL client can find the underlying queries usingSHOW CREATE VIEW. -
Click the large > button.
If you receive an error stating
One or more sources has no closed timestamps, wait a few seconds, press enter in the query editor, and then repeat this process. -
Once you see the results similar to those below, click Save, enter query01 as the query’s name, and then click Save.
-
When asked if you want to save this to a dashboard, click Yes please!.
-
Click My personal collection, and then click Create a new dashboard.
-
Enter tpcch as the Name, and then click Create.
-
Modify the size of the query01 card, and then click Save.
-
Click Auto-refresh, and then select 1 minute.
60 seconds is the fastest refresh rate selectable in the UI, but if you copy the URL, open a new tab and edit the end of the url to change the
refresh=60anchor torefresh=1you can force metabase to update every second.

Recap
In this demo, we saw:
- How to define sources and views within Materialize
- How to query defined views in a BI tool
- Materialize’s ability to serve results for views with the fastest refresh rates the tool offers
Details
Typical operation
In this demo, you “played” the role of both infrastructure engineer and business analyst; that is to say, you both deployed Materialize, as well as ran queries within your BI tool, Metabase.
To give you a sense of what this experience would look like if you were two different people, let’s highlight what the expected workflow is.
- Business analysts perform ad hoc queries in Materialize to determine what queries are meaningful to them.
- Business analysts then provide those queries to DBAs.
- DBAs turn those queries into materialized views, and then provide the
business analysts with the views' names, e.g.
some_view. Business analysts then query those views from within their BI tools, e.g.SELECT * FROM some_view.
Of course, it’s possible to change this workflow to make it more self-service, etc. but this is a reasonable workflow.